Tuesday 15 October 2013

The Matthew effect and REF2014


For unto every one that hath shall be given, and he shall have abundance: but from him that hath not shall be taken away even that which he hath. Matthew 25:29


So you’ve slaved over your departmental submission for REF2014, and shortly will be handing it in. A nervous few months await before the results are announced. You’ve sweated blood over deciding whether staff publications or impact statements will be graded as 1*, 2*, 3* or 4*, but it’s not possible to predict how the committee will judge them, nor, more importantly, how these ratings will translate into funding. In the last round of evaluation, in 2008, a weighted formula was used, such that a submission earned 1 point for every 2* output, 3 points for every 3* output, and 7 points for every 4* output. Rumour has it that this year there may be no money for 2* outputs and even more for 4*. It will be more complicated than this, because funding allocations will also take into account ratings of ‘impact statements’, and the ‘environment’.

I’ve blogged previously about concerns I have with the inefficiency of the REF2014 as a method for allocating funds. Today I want to look at a different issue: the extent to which the REF increases disparities between universities over time. To examine this, I created a simulation which made a few simple assumptions. We start with a sample of 100 universities, each of which is submitting 50 staff in a Unit of Assessment. At the outset, we start with all universities equal in terms of the research quality of their staff: they are selected at random from a pool of possible staff whose research quality is normally distributed. Funding is then allocated according to the formula used in RAE2008. The key feature of the simulation is that over every assessment period there is turnover of staff (estimated at 10% in simulation shown here), and universities with higher funding levels are able to recruit replacement staff with higher scores on the research quality scale. These new staff are then the basis for computing funding allocations in the next cycle – and so on, through as many cycles as one wishes. This simulation shows that funding starts out fairly normally distributed, but as we progress through each cycle, it becomes increasingly skewed, with the top-performers moving steadily away from the rest (Figure A). In the graphs, funding is shown over time for universities grouped in deciles, i.e., bands of 10 universities after ranking by funding level.
Simulation: Mean income for universities in each of 10 deciles over 6 funding cycles

Depending on specific settings of parameters in the model, we may even see a bimodal distribution developing over time: a large pool of ‘have-nots’ vs an elite group of ‘haves’. Despite the over-simplifications of the model, I would argue that it captures an essential feature of the current funding framework: funding goes to those who are successful, allowing them to enter a positive feedback loop whereby they can recruit more high-calibre researchers and become even more successful – and hence gain even more funds in the next round. For those who are unsuccessful, it can be hard to break out of a downward spiral into research inactivity.

We could do things differently. Figure B shows how tweaking the funding model could avoid opening up such a wide gulf between the richest and poorest, and retain a solid core of middle-ranking universities.
Simulation using linear weighting of * levels. Each line is average for institutions in a given decile
Figure C, on the other hand, shows how a formula that predominantly rewards 4* outputs (weighting of 1 for 3* and 7 for 4*, which is rumoured to be a possible formula used in REF2014). This would dramatically increase the gulf between the elite and other institutions.
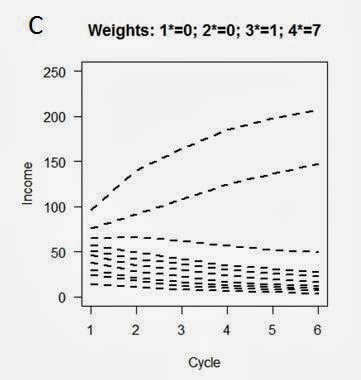
Simulation where 4* outputs get favoured. Each line is average for institutions in a given decile
I’m sure people will have very different views about whether or not the consequences illustrated here are desirable. One argument is that it is best to concentrate our research strength in a few elite institutions. That way the UK will be able to compete with the rest of the world in University league tables. Furthermore, by pooling the brightest brains in places where they have the best resources to do research, we have a chance of making serious breakthroughs. We could even use biblical precedent to justify such an approach: the Matthew effect refers to the biblical parable of the talents, in which servants are entrusted different sums of money by their master, and those who have most make the best use of it. There is no sympathy for those with few resources: they fail to make good use of what they do have and end up cast out into outer darkness, where there is weeping and gnashing of teeth. This robust attitude characterises those who argue that only internationally outstanding research should receive serious funding.

However, given that finances are always limited, there will be a cost to the focus on an elite; the middle-ranking universities will get less funding, and be correspondingly less able to attract high-calibre researchers. And it could be argued that we don’t just need an elite: we need a reasonable number of institutions in which there is a strong research environment, where more senior researchers feel valued and their graduate students and postdocs are encouraged to aim high. Our best strategy for retaining international competitiveness might be by fostering those who are doing well but have potential to do even better. In any case, much research funding is awarded through competition for grants, and most of this goes to people in elite institutions, so these places will not be starved of income if we were to adopt a more balanced system of awarding central funds.

What worries me most is that I haven’t been able to find any discussion of this issue – namely, whether the goal of a funding formula should be to focus on elite institutions or distribute funds more widely. The nearest thing I’ve found so far is a paper analysing a parallel issue in grant awards (Fortin & Curry, 2013) – which comes to the conclusion that broader distribution of smaller grants is more effective than narrowly distributed large grants. Very soon, somebody somewhere is going to decide on the funding formula, and if rumours are to be believed, it will widen the gap between the haves and have-nots even further. I'm concerned that if we continue to concentrate funding only in those institutions with a high proportion of research superstars, we may be creating an imbalance in our system of funding that will be bad for UK research in the long run.

Reference  

Fortin JM, & Currie DJ (2013). Big Science vs. Little Science: How Scientific Impact Scales with Funding. PloS one, 8 (6) PMID: 23840323

Thursday 10 October 2013

On the need for responsible reporting of research to the media

This was one of the first tweets I saw when I woke up this morning :


In response, a parent of two girls with autism tweeted "gutted to read this. B's statement has been final for 1 yr but no therapy has been done. we're still waiting."

I was really angry. A parent who is waiting for therapy for a child has many reasons to be upset. But the study described on the BBC Website did NOT identify a 'critical window'. It was not about autism and not about intervention.

I was aware of the study because I'd been asked by the Science Media Centre to comment on an embargoed version a couple of days ago.

These requests for commentary on embargoed papers always occur very late in the day, which makes it difficult to give a thorough appraisal. But I felt I'd got the gist: the researchers had recruited 108 children aged between 1 and 6 years and done scans to look at the development of white matter in the brain. They also gave children a well-known test of cognitive development, the Mullen scales, which assesses language, visual and fine motor skills. It's not clear where the children came from, but their scores on the Mullen scales were pretty average, and as far as I can tell, none of them had any developmental disorders.

The researchers were particularly interested in lateralisation: the tendency to have more white matter on one side of the brain than the other. Left-sided lateralisation of white matter in some brain regions is well-established in adults but there's been debate as to whether this is something that develops early in life, or whether it is present from birth. In the introduction, the authors state that this lateralisation is strongly heritable, but although that's often claimed, the evidence doesn't support it (Bishop, 2013). A preponderance of white matter in the left hemisphere is of interest because in most people, the left side of the brain is strongly involved in language processing.

The authors estimated lateralisation in numerous regions of the left and right brain using a measure termed the myelin water fraction. Myelin is a fatty sheath that develops around the axons of cells in the brain, leading to improved efficiency of neural transmission. Myelination is a well-established phenomenon in brain development.

The main findings I took away from the paper were (a) myelin is asymmetrically distributed in the brains of young children, with many regions showing greater myelin density in the left than the right; (b) although the amount of myelin increases with age, the extent of lateralisation is stable from 1 to 6 years. This is an important finding.

The authors, however, put most focus on another aspect of the study: the relationship between myelin lateralisation and language level. Overall, there was no relationship with asymmetry of a temporal-occipital region that overlapped with the arcuate fasciculus, a fibre tract important for language that previously had given rather inconsistent results (see Bishop, 2013). However, looking at a total of eight brain regions and four cognitive measures, they found two regions where leftward asymmetry was related to language or visual measures, and one where rightward asymmetry was related to expressive and receptive language.

Their primary emphasis, however, was on another finding, that there were interactions between age and lateralisation, so that, for instance, left-sided lateralisation of myelin in a region encompassing caudate/thalamus and frontal cortex only became correlated with language level in older children. I found it hard to know how much confidence to place in this result: the authors stated that they corrected for multiple comparisons using false discovery rate, but if, as seems the case, they looked at both main effects and interaction terms in 32 statistical analyses, then some of these findings could be chance.

Be that as it may, it is an odd result. Remember that this was a cross-sectional study and that on no index was there an age effect on lateralisation. So it does not show that changes in language ability - which are substantial over this age range - are driven by changes in lateralisation of myelin. So what do the authors say? Well, in the paper, they conclude "The data presented here are cross sectional, longitudinal analysis will allow us to confirm these findings; however, the changing interaction between ability and myelin may be mediated by progressive functional specialization in these connected cortical regions, which itself is partly mediated by environmental influences" (p. 16175). But this is pure speculation: they have not measured functional specialisation, and, as they appear to recognise, without longitudinal data, it is premature to interpret their results as indicating change with age.

If you've followed me so far, you may be wondering when I'm going to get on to the bit about intervention for autism and critical periods. Well, there's no data in this paper on that topic. So why did the BBC publish an account of the paper likely to cause dismay and alarm in parents of children with language and communication problems? The answer is because King's College London put out a press release about this study that contained at least as much speculation as fact. We are told that the study "reveals a particular window, from 2 years to the age of 4, during which environmental influence on language development may be greatest." It doesn't do anything of the kind. They say: "the findings help explain why, in a bilingual environment, very young typically developing children are better capable of becoming fluent in both languages; and why interventions for neurodevelopmental disorders where language is impaired, such as autism, may be much more successful if implemented at a very young age. " Poppycock.

A few months ago the same press office put out a similarly misleading press release about another study, quoting the principal researcher as stating: “Now we understand that this is how we learn new words, our concern is that children will have less vocabulary as much of their interaction is via screen, text and email rather than using their external prosthetic memory. This research reinforces the need for us to maintain the oral tradition of talking to our children.” As I noted elsewhere, the study was not about children, computers or word learning.

I can see that there is a problem for researchers doing studies of structural brain development. It can be hard to excite the general public about the results unless you talk about potential implications. It is frankly irresponsible, though, to go so far beyond your data that the headline is based on the speculation rather than the findings.

I am tired of researchers trying to make their studies relevant by dragging in potential applications to autism, schizophrenia, or dyslexia, when they haven't done any research on clinical groups. They need to remember that there are real people out there whose everyday life is affected by these conditions, and that neither they nor the media can easily discriminate what a study actually found from speculations about its implications. It is the duty of researchers and press officers to be crystal clear about that distinction to avoid causing confusion and distress.

POSTSCRIPT
11/10/13: Dr O'Muircheartaigh has commented below to absolve the KCL Press Office of any responsibility for the content of their press release. I apologise for assuming that they were involved in decisions about how to publicise this research and have reworded parts of this blogpost to remove that implication.


References 

Bishop, D. V. M. (2013). Cerebral asymmetry and language development: Cause, correlate, or consequence? Science, 340 (6138) DOI: 10.1126/science.1230531

O'Muircheartaigh, J., Dean, D. C., Dirks, H., Waskiewicz, N., Lehman, K., Jerskey, B. A., & Deoni, S. C. L. (2013). Interactions between white matter asymmetry and language during neurodevelopment. Journal of Neuroscience, 33(41), 16170-16177. doi: 10.1523/jneurosci.1463-13.2013


Wednesday 9 October 2013

High time to revise the PhD thesis format

Before the electronic age: Henry Wellcome's dissertation from 1874
I don't know how it works in other countries, but in the UK, if you agree to examine a PhD thesis, odds are you will receive a bound document of some 250-400 pages to evaluate. You are not supposed to write on it. You may be explicitly forbidden to obtain an electronic version of the document.

There are ways of dealing with this: the most useful one, taught to me by Uta Frith when we co-examined a thesis some years ago, was to make ample use of post-it notes. However, this is still pretty tedious. What I want is a loose-leaf document that I can write on. I want, when travelling on a train to be able to take a chapter or two with me.

Please, can somebody fix this?

Saturday 5 October 2013

Good and bad news on the phonics screen


Teaching children to read is a remarkably fraught topic. Last year the UK Government introduced a screening check to assess children’s ability to use phonics – i.e., to decode letters into sounds. Judging from the reaction in some quarters they might as well have announced they were going to teach 6-year-olds calculus. The test, we were told, would confuse and upset children and not tell teachers anything they did not already know. Some people implied that there was an agenda to teach children to read solely using meaningless materials. This, of course, is not the case. Nonwords are used in assessment precisely because you need to find out if the child has the skills to attack an unfamiliar word by working out the sounds. Phonics has been ignored or rejected for many years by those who assumed that if you taught phonics the child would be doomed to an educational approach that involved boring drills in meaningless materials. This is not the case: for instance, Kevin Wheldall argues that children need to combine teaching of phonics with training in vocabulary and comprehension, and storybook reading with real texts should be a key component of reading instruction.
There is evidence for the effectiveness of phonics training from controlled trials,  and I therefore regard it as a positive move that the government has endorsed the  use of phonics in schools. However, they continue to meet resistance from many teachers, for a whole range of reasons. Some just don’t like phonics. Some don’t like testing children, especially when the outcome is a pass/fail classification. Many fear that the government will use results of a screening test to create league tables of schools, or to identify bad teachers. Others question the whole point of screening: This recent piece from the BBC website quotes Christine Blower, the head of the National Union of Teachers, as saying: "Children develop at different levels, the slow reader at five can easily be the good reader by the age of 11.” To anyone familiar with the literature on predictors of children’s reading, this shows startling levels of complacency and ignorance. We have known for years that you can predict with good accuracy which children are likely to be poor readers at 11 years from their reading ability at 6 (Butler et al, 1985).
When the results from last year's phonics screen came out I blogged about them, because they looked disturbingly dodgy, with a spike in the frequency distribution at the pass mark of 32. On Twitter, @SusanGodsland has pointed me to a report on the 2012 data where this spike was discussed. This noted that the spike in the distribution was not seen in a pilot study where the pass mark had not been known in advance. The spike was played down in this report, and attributed to “teachers accounting for potential misclassification in the check results, and using their teacher judgment to determine if children are indeed working at the expected standard.” It was further argued that the impact of the spike was small, and would lead to only around 4% misclassification.
However, a more detailed research report on the results was rather less mealy-mouthed about the spike and noted “the national distribution of scores suggests that pupils on the borderline may have been marked up to meet the expected standard.” The authors of that report did the best they could with the data and carried out two analyses to try to correct for the spike. In the first, they deleted points in the distribution where the linear pattern of increase in scores was disrupted, and instead interpolated the line. They concluded that this gave 54% rather than 58% of children passing the screen. The second approach, which they described as more statistically robust, was to take all the factors that they had measured that predicted scores on the phonics screen, ignoring cases with scores close to the spike, and then use these to predict the percentage passing the screen in the whole population. When this method was used, only 46% of children were estimated to have passed the screen when the spike was corrected for.
Well, this year’s results have just been published. The good news is that there is an impressive increase in percentage of children passing from 2012 to 2013, up from 58% to 69%. This suggests that the emphasis on phonics is encouraging teachers to teach children about how letters and sounds go together.
But any positive reaction to this news is tinged with a sense of disappointment that once again we have a most peculiar distribution with a spike at the pass mark. 
 
Proportions of children with different scores on phonics screen in 2012 and 2013. Dotted lines show interpolated values.

I applied the same correction as had been used for the 2012 data, i.e. interpolating the curve over the dodgy area. This suggested that the proportion of cases passing the screen was overestimated by about 6% for both 2012 and 2013. (The precise figure will depend on the exact way the interpolation is done). 
Of course I recognise that any pass mark is arbitrary, and children’s performance may fluctuate and not always represent their true ability. The children who scored just below the pass mark may indeed not warrant extra help with reading, and one can see how a teacher may be tempted to nudge a score upward if that is their judgement. Nevertheless, teachers who do this are making it difficult to rely on the screen data and to detect whether there are any improvements year on year. And it undermines their professional status if they cannot be trusted to administer a simple reading test objectively.
It has been announced that the pass mark for the phonics screen won’t be disclosed in advance in 2014, which should reduce the tendency to nudge scores up. However, if the pass mark differs from previous years, then the tests won’t be comparable, so it seems likely that teachers will be able to guess it will remain at 32. Perhaps one solution would be to ask the teacher to make a rating of whether or not the test result agrees with their judgement of the child’s ability. If they have an opportunity to give their professional opinion, they may be less tempted to tweak test results. I await with interest the results from 2014!

Reference
Butler, Susan R., Marsh, Herbert W., Sheppard, Marlene J., & Sheppard, John L (1985). Seven-year longitudinal study of the early prediction of reading achievement Journal of Educational Psychology, 77, 349-361 DOI: 10.1037//0022-0663.77.3.349